
Learn how to leverage Python and deep learning to analyze dividend cuts, calculate key financial metrics, and uncover advanced insights for strategic investment decisions.
In this article, we’ll thoroughly explore dividend data analysis. We’ll look at the different aspects of dividend data, process them, and calculate key metrics needed for effective dividend analysis using Python and deep learning.
Python’s versatile libraries and frameworks facilitate intricate financial analyses. Deep learning, a branch of machine learning, further enhances these capabilities by identifying patterns within large datasets that human analysts might overlook. These patterns can help forecast future dividend trends, providing a valuable advantage in trading strategies.
A central part of our analysis is EODHD APIs. This API delivers comprehensive financial data, including extensive dividend histories crucial for our study. By blending Python’s analytical capabilities with deep learning algorithms and the real-time financial data from the EODHD APIs, we can extract valuable insights from dividend data, empowering traders to make more informed, data-driven decisions.
In this article, we’ll explore how to effectively harness these tools to enhance trading strategies through advanced dividend analysis. Our goal is to provide deeper insights into dividend trends, giving you a significant edge in decision-making.
Configuring Python and EODHD API for Dividend Data Analysis
To begin, it’s crucial to set up Python properly for financial analysis. Make sure you install key libraries like Pandas, NumPy, and Matplotlib to manipulate and visualize financial data. Additionally, integrating the EODHD API provides access to comprehensive financial information vital for dividend analysis.
Here’s a basic guide to start working with the EODHD API in Python:
1. Creating a Python Virtual Environment:
– Creating a virtual environment isolates your project’s dependencies.
– Run the following commands:
python3 -m venv myenv
and
source myenv/bin/activate.
Replace “myenv” with your desired environment name. You can skip this step if you prefer to use your existing environment.
2. Installing the EODHD API Library:
– To access live and historical stock data, install the EODHD library. It offers additional features that can aid in your analysis.
– Use pip to install:
pip install eodhd -U.
This ensures you have the latest version.
3. Installing Additional Libraries:
- Install other essential libraries like NumPy, Pandas, and Matplotlib for data manipulation and visualization:
import pandas as pd
import numpy as np
import matplotlib.pyplot as plt
from eodhd import APIClient
import requests
With these steps, you’ll be equipped with the necessary tools to perform advanced dividend data analysis using Python and the EODHD API.
4. Setting Up the EODHD API Client
Now, let’s configure the EODHD API to kick off our dividend analysis. Begin by initializing the client with your API key, which you can obtain from the EODHD API access page:
api_key = "Your_API_Key"
base_url = 'https://eodhistoricaldata.com/api'
5. Fetching Historical Dividend Data
To retrieve the dividend data for a particular stock, we’ll use a function that queries the appropriate endpoint. For this example, we will analyze the dividend data for Nvidia (NVDA).
# Function to fetch dividend data
def fetch_dividend_data(symbol):
    endpoint = f"{base_url}/div/{symbol}"
    params = {
        'api_token': api_key,
        'fmt': 'json'
    }
    response = requests.get(endpoint, params=params)
    if response.status_code == 200:
        return response.json()
    else:
        return None

stock_symbol = 'NVDA'

dividend_data = fetch_dividend_data(stock_symbol)
df_nvda = pd.DataFrame(dividend_data)
After running the above code, you will have a Pandas DataFrame containing Nvidia’s dividend data. Now, let’s see how this data looks for further analysis.
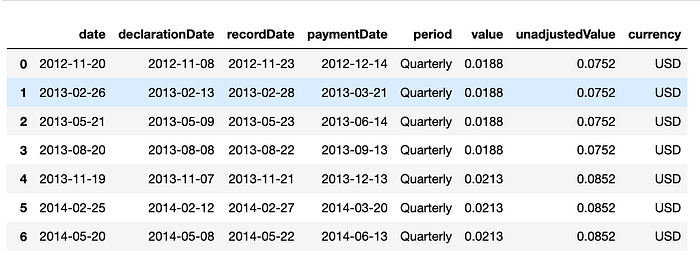
6. Data Preparation and Visualization
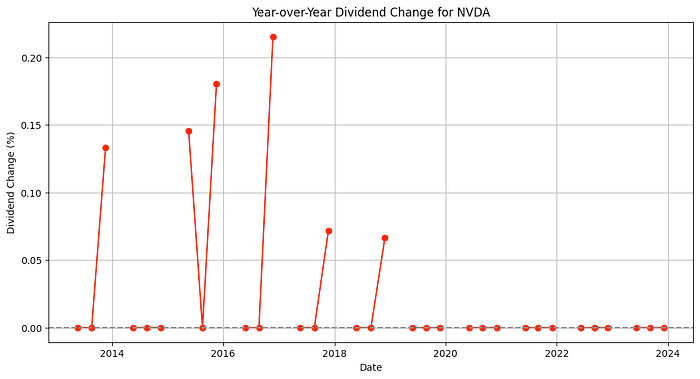
Now, let’s enhance the dataset by adding more features like the year and performing some data processing. After that, we’ll create a visualization to illustrate how Nvidia’s dividends have fluctuated since 2012.
df_nvda['date'] = pd.to_datetime(df_nvda['date'])
df_nvda['paymentDate'] = pd.to_datetime(df_nvda['paymentDate'])
df_nvda.sort_values('date', inplace=True)

df_nvda['year'] = df_nvda['date'].dt.year
df['dividend_change'] = df.groupby('year')['value'].transform(lambda x: x.pct_change())

plt.figure(figsize=(12,6))
plt.plot(df_nvda['date'], df_nvda['dividend'], marker='o', color='b')
plt.xlabel('Date')
plt.ylabel('Dividend Value')
plt.title('Quarterly Dividend Trend for NVDA')
plt.grid(True)
plt.show()
Mathematical Foundations of Dividend Analysis
A thorough analysis of dividends requires quantifiable metrics to understand a company’s policies and stability. These metrics are essential for investors aiming to gauge and forecast dividend distributions.
1. Dividend Yield
The dividend yield shows how much a company pays out in dividends annually compared to its share price, providing an indication of the income generated by an investment.